Hidden in Plain Sight: Why the UK needs a new Clean Air Act
Air pollution is often invisible. But its impact is everywhere.
That’s why the Healthy Air Coalition is launching the Hidden in Plain Sight campaign, calling on the Government to deliver a new, modern Clean Air Act that protects everyone’s right to breathe clean air.
Today, 98.7% of people in England live in areas exceeding World Health Organization guidelines for fine particulate matter PM2.5 pollution. That’s 57.9 million people breathing unsafe air.
And while many think of air pollution as a city problem, toxic air affects rural communities too. Areas including Cannock Chase, West Suffolk and Cornwall are estimated to have pollution levels comparable to Birmingham and Luton.
The burden is not shared equally. Across England, 27 areas face a “double burden” of the highest pollution levels combined with the highest levels of deprivation.
We are calling on the Government to honour its commitment to public health by introducing a new Clean Air Act that adopts World Health Organization guidelines and prevents air quality targets from being weakened in the future.
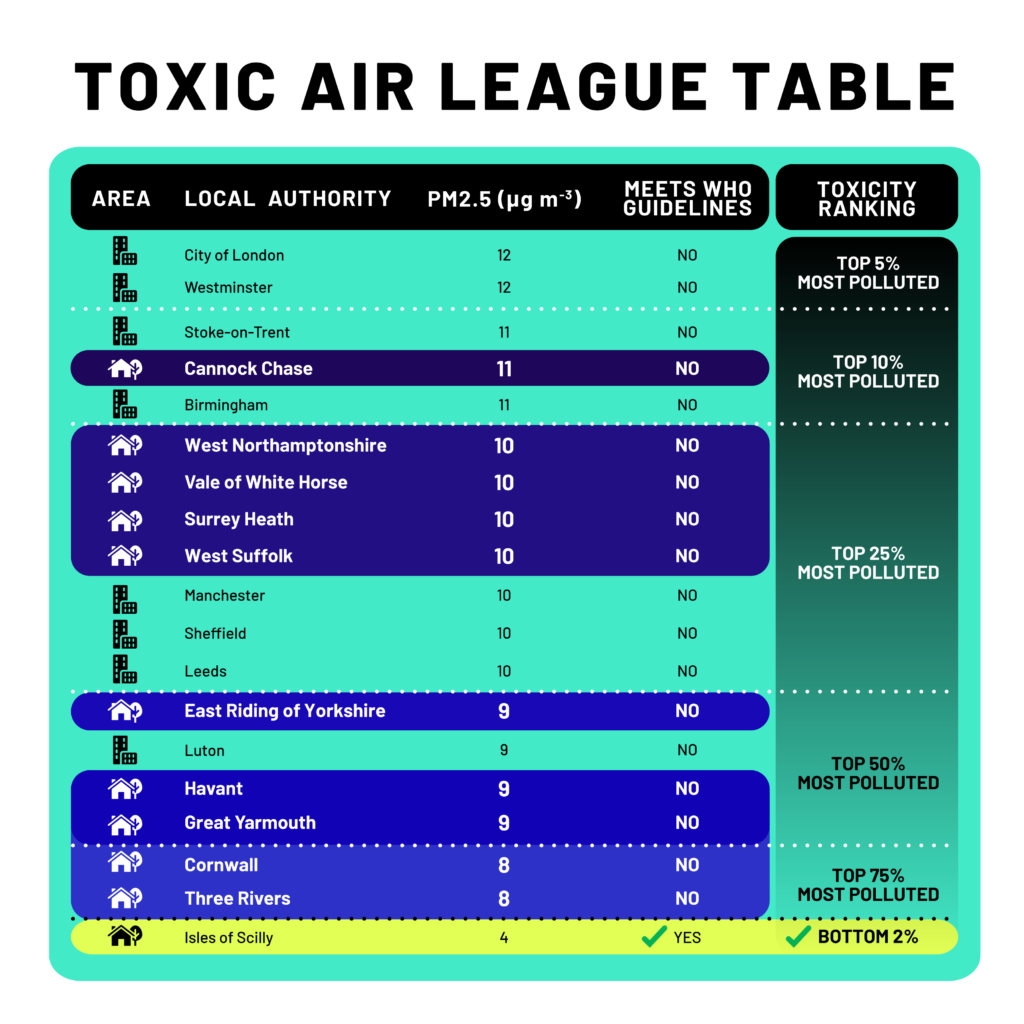
See below where your local area ranks in the Toxic Air League Table:
Doesn’t meet WHO guideline level of 5 μg/m³
City of London – 12 μg/m³
Camden – 12 μg/m³
Ealing – 12 μg/m³
Greenwich – 12 μg/m³
Hackney – 12 μg/m³
Hammersmith and Fulham – 12 μg/m³
Islington – 12 μg/m³
Kensington and Chelsea – 12 μg/m³
Newham – 12 μg/m³
Redbridge – 12 μg/m³
Tower Hamlets – 12 μg/m³
Waltham Forest – 12 μg/m³
Westminster – 12 μg/m³
Stoke-on-Trent – 11 μg/m³
Thurrock – 11 μg/m³
Cannock Chase – 11 μg/m³
Birmingham – 11 μg/m³
Barking and Dagenham – 11 μg/m³
Barnet – 11 μg/m³
Bexley – 11 μg/m³
Brent – 11 μg/m³
Enfield – 11 μg/m³
Haringey – 11 μg/m³
Havering – 11 μg/m³
Hillingdon 11 μg/m³
Hounslow 11 μg/m³
Kingston upon Thames – 11 μg/m³
Lambeth – 11 μg/m³
Lewisham – 11 μg/m³
Southwark – 11 μg/m³
Kingston upon Hull – 10 μg/m³
Derby – 10 μg/m³
Leicester – 10 μg/m³
Nottingham – 10 μg/m³
Peterborough – 10 μg/m³
Southend-on-Sea – 10 μg/m³
Medway – 10 μg/m³
West Northamptonshire – 10 μg/m³
Bolsover – 10 μg/m³
Basildon – 10 μg/m³
Colchester – 10 μg/m³
Rochford – 10 μg/m³
Rushmoor – 10 μg/m³
Broxbourne – 10 μg/m³
Dartford – 10 μg/m³
Tonbridge and Malling – 10 μg/m³
Ashfield – 10 μg/m³
Cherwell – 10 μg/m³
Vale of White Horse – 10 μg/m³
Guildford – 10 μg/m³
Runnymede – 10 μg/m³
Spelthorne – 10 μg/m³
Surrey Heath – 10 μg/m³
Rugby – 10 μg/m³
Horsham – 10 μg/m³
West Suffolk – 10 μg/m³
Manchester – 10 μg/m³
Oldham – 10 μg/m³
Salford – 10 μg/m³
Stockport – 10 μg/m³
Tameside – 10 μg/m³
Rotherham – 10 μg/m³
Sheffield – 10 μg/m³
Coventry – 10 μg/m³
Dudley – 10 μg/m³
Sandwell – 10 μg/m³
Solihull – 10 μg/m³
Walsall – 10 μg/m³
Wolverhampton – 10 μg/m³
Bradford – 10 μg/m³
Leeds – 10 μg/m³
Bromley – 10 μg/m³
Croydon – 10 μg/m³
Merton – 10 μg/m³
Richmond upon Thames – 10 μg/m³
Sutton – 10 μg/m³
Wandsworth – 10 μg/m³
Middlesbrough – 9 μg/m³
Stockton-on-Tees – 9 μg/m³
Halton – 9 Yes μg/m³
Warrington – 9 μg/m³
East Riding of Yorkshire – 9 μg/m³
North East Lincolnshire – 9 μg/m³
North Lincolnshire – 9 μg/m³
Bristol City of – 9 μg/m³
South Gloucestershire – 9 μg/m³
Luton – 9 μg/m³
Bracknell Forest – 9 μg/m³
West Berkshire – 9 μg/m³
Reading – 9 μg/m³
Slough – 9 μg/m³
Windsor and Maidenhead – 9 μg/m³
Wokingham – 9 μg/m³
Milton Keynes – 9 μg/m³
Portsmouth – 9 μg/m³
Southampton – 9 μg/m³
Bedford – 9 μg/m³
Buckinghamshire – 9 μg/m³
North Northamptonshire – 9 μg/m³
Chesterfield – 9 μg/m³
Erewash – 9 μg/m³
South Derbyshire – 9 μg/m³
Castle Point – 9 μg/m³
Chelmsford – 9 μg/m³
Epping Forest – 9 μg/m³
Cheltenham – 9 μg/m³
Forest of Dean – 9 μg/m³
Basingstoke and Deane – 9 μg/m³
Fareham – 9 μg/m³
Havant – 9 μg/m³
New Forest – 9 μg/m³
Dacorum – 9 μg/m³
Hertsmere – 9 μg/m³
North Hertfordshire – 9 μg/m³
Watford – 9 μg/m³
Gravesham – 9 μg/m³
Maidstone – 9 μg/m³
Swale – 9 μg/m³
Rossendale – 9 μg/m³
Blaby – 9 μg/m³
Charnwood – 9 μg/m³
Boston – 9 μg/m³
Lincoln – 9 μg/m³
South Kesteven – 9 μg/m³
Great Yarmouth – 9 μg/m³
King’s Lynn and West Norfolk – 9 μg/m³
Norwich – 9 μg/m³
Broxtowe – 9 μg/m³
Gedling – 9 μg/m³
Mansfield – 9 μg/m³
Rushcliffe – 9 μg/m³
Oxford – 9 μg/m³
Lichfield – 9 μg/m³
Newcastle-under-Lyme – 9 μg/m³
Stafford – 9 μg/m³
Staffordshire Moorlands – 9 μg/m³
Tamworth – 9 μg/m³
Ipswich – 9 μg/m³
Elmbridge – 9 μg/m³
Epsom and Ewell – 9 μg/m³
Mole Valley – 9 μg/m³
Reigate and Banstead – 9 μg/m³
Woking – 9 μg/m³
North Warwickshire – 9 μg/m³
Nuneaton and Bedworth – 9 μg/m³
Crawley – 9 μg/m³
Mid Sussex – 9 μg/m³
Bromsgrove – 9 μg/m³
Wychavon – 9 μg/m³
Welwyn Hatfield – 9 μg/m³
East Hertfordshire – 9 μg/m³
Stevenage – 9 μg/m³
Bolton – 9 μg/m³
Bury – 9 μg/m³
Rochdale – 9 μg/m³
Trafford – 9 μg/m³
Liverpool – 9 μg/m³
Barnsley – 9 μg/m³
Doncaster – 9 μg/m³
North Tyneside – 9 μg/m³
South Tyneside – 9 μg/m³
Sunderland – 9 μg/m³
Calderdale – 9 μg/m³
Kirklees – 9 μg/m³
Wakefield – 9 μg/m³
Gateshead – 9 μg/m³
Harrow – 9 μg/m³
Belfast – 9 μg/m³
South Lanarkshire – 9 μg/m³
North Lanarkshire – 9 μg/m³
Flintshire – 9 μg/m³
Cardiff – 9 μg/m³
Hartlepool – 8 μg/m³
Blackburn with Darwen – 8 μg/m³
Blackpool – 8 μg/m³
York – 8 μg/m³
Rutland – 8 μg/m³
Telford and Wrekin – 8 μg/m³
Bath and North East Somerset – 8 μg/m³
Plymouth – 8 μg/m³
Swindon – 8 μg/m³
Brighton and Hove – 8 μg/m³
County Durham – 8 μg/m³
Cheshire East – 8 μg/m³
Cheshire West and Chester – 8 μg/m³
Cornwall – 8 μg/m³
Wiltshire – 8 μg/m³
Central Bedfordshire – 8 μg/m³
Bournemouth, Christchurch and Poole – 8 μg/m³
North Yorkshire – 8 μg/m³
Cambridge – 8 μg/m³
East Cambridgeshire – 8 μg/m³
Fenland – 8 μg/m³
Huntingdonshire – 8 μg/m³
South Cambridgeshire – 8 μg/m³
Amber Valley – 8 μg/m³
High Peak – 8 μg/m³
North East Derbyshire – 8 μg/m³
Eastbourne – 8 μg/m³
Hastings – 8 μg/m³
Lewes – 8 μg/m³
Rother – 8 μg/m³
Wealden – 8 μg/m³
Braintree – 8 μg/m³
Brentwood – 8 μg/m³
Harlow – 8 μg/m³
Tendring – 8 μg/m³
Uttlesford – 8 μg/m³
Cotswold – 8 μg/m³
Gloucester – 8 μg/m³
Tewkesbury – 8 μg/m³
Eastleigh – 8 μg/m³
Hart – 8 μg/m³
Test Valley – 8 μg/m³
Three Rivers – 8 μg/m³
Ashford – 8 μg/m³
Canterbury – 8 μg/m³
Dover – 8 μg/m³
Sevenoaks – 8 μg/m³
Folkestone and Hythe – 8 μg/m³
Thanet – 8 μg/m³
Tunbridge Wells – 8 μg/m³
Burnley – 8 μg/m³
Chorley – 8 μg/m³
Hyndburn – 8 μg/m³
South Ribble – 8 μg/m³
Harborough – 8 μg/m³
Hinckley and Bosworth – 8 μg/m³
Melton – 8 μg/m³
North West Leicestershire – 8 μg/m³
Oadby and Wigston – 8 μg/m³
East Lindsey – 8 μg/m³
North Kesteven – 8 μg/m³
West Lindsey – 8 μg/m³
Breckland – 8 μg/m³
Broadland – 8 μg/m³
South Norfolk – 8 μg/m³
Bassetlaw – 8 μg/m³
Newark and Sherwood – 8 μg/m³
South Oxfordshire – 8 μg/m³
East Staffordshire – 8 μg/m³
South Staffordshire – 8 μg/m³
Babergh – 8 μg/m³
Mid Suffolk – 8 μg/m³
Tandridge – 8 μg/m³
Warwick – 8 μg/m³
Adur – 8 μg/m³
Arun – 8 μg/m³
Chichester – 8 μg/m³
Worthing – 8 μg/m³
Redditch – 8 μg/m³
Worcester – 8 μg/m³
Wyre Forest – 8 μg/m³
St Albans – 8 μg/m³
East Suffolk – 8 μg/m³
Wigan – 8 μg/m³
Knowsley – 8 μg/m³
St. Helens – 8 μg/m³
Sefton – 8 μg/m³
Wirral – 8 μg/m³
Newcastle upon Tyne – 8 μg/m³
Derry City and Strabane – 8 μg/m³
City of Edinburgh – 8 μg/m³
Wrexham – 8 μg/m³
Neath Port Talbot – 8 μg/m³
Rhondda Cynon Taf – 8 μg/m³
Torfaen – 8 μg/m³
Newport – 8 μg/m³
Redcar and Cleveland – 7 μg/m³
Darlington – 7 μg/m³
Herefordshire County of – 7 μg/m³
North Somerset – 7 μg/m³
Torbay – 7 μg/m³
Isle of Wight – 7 μg/m³
Shropshire – 7 μg/m³
Northumberland – 7 μg/m³
Dorset – 7 μg/m³
Westmorland and Furness – 7 μg/m³
Somerset – 7 μg/m³
Derbyshire Dales – 7 μg/m³
East Devon – 7 μg/m³
Exeter – 7 μg/m³
Teignbridge – 7 μg/m³
Maldon – 7 μg/m³
Stroud – 7 μg/m³
East Hampshire – 7 μg/m³
Gosport – 7 μg/m³
Winchester – 7 μg/m³
Fylde – 7 μg/m³
Lancaster – 7 μg/m³
Pendle – 7 μg/m³
Preston – 7 μg/m³
Ribble Valley – 7 μg/m³
West Lancashire – 7 μg/m³
South Holland – 7 μg/m³
North Norfolk – 7 μg/m³
West Oxfordshire – 7 μg/m³
Waverley – 7 μg/m³
Stratford-on-Avon – 7 μg/m³
Malvern Hills – 7 μg/m³
Lisburn and Castlereagh – 7 μg/m³
Falkirk – 7 μg/m³
Stirling – 7 μg/m³
Renfrewshire – 7 μg/m³
Glasgow City – 7 μg/m³
Conwy – 7 μg/m³
Swansea – 7 μg/m³
Vale of Glamorgan – 7 μg/m³
Caerphilly – 7 μg/m³
Monmouthshire – 7 μg/m³
Cumberland – 6 μg/m³
Mid Devon – 6 μg/m³
North Devon – 6 μg/m³
South Hams – 6 μg/m³
West Devon – 6 μg/m³
Wyre – 6 μg/m³
Antrim and Newtownabbey – 6 μg/m³
Armagh City, Banbridge and Craigavon – 6 μg/m³
Mid and East Antrim – 6 μg/m³
Mid Ulster – 6 μg/m³
Newry Mourne and Down – 6 μg/m³
Ards and North Down – 6 μg/m³
Clackmannanshire – 6 μg/m³
East Ayrshire – 6 μg/m³
East Lothian – 6 μg/m³
East Renfrewshire – 6 μg/m³
Highland – 6 μg/m³
Inverclyde – 6 μg/m³
Midlothian – 6 μg/m³
North Ayrshire – 6 μg/m³
Aberdeen City – 6 μg/m³
West Dunbartonshire – 6 μg/m³
West Lothian – 6 μg/m³
Dundee City – 6 μg/m³
East Dunbartonshire – 6 μg/m³
Fife – 6 μg/m³
Gwynedd – 6 μg/m³
Denbighshire – 6 μg/m³
Pembrokeshire – 6 μg/m³
Carmarthenshire – 6 μg/m³
Bridgend – 6 μg/m³
Blaenau Gwent – 6 μg/m³
Merthyr Tydfil – 6 μg/m³
Meets WHO guideline level of 5 μg/m³
Torridge – 5 μg/m³
Causeway Coast and Glens – 5 μg/m³
Fermanagh and Omagh – 5 μg/m³
Dumfries and Galloway – 5 μg/m³
Moray – 5 μg/m³
Orkney Islands – 5 μg/m³
Scottish Borders – 5 μg/m³
South Ayrshire – 5 μg/m³
Aberdeenshire – 5 μg/m³
Argyll and Bute – 5 μg/m³
Angus – 5 μg/m³
Perth and Kinross – 5 μg/m³
Isle of Anglesey – 5 μg/m³
Ceredigion – 5 μg/m³
Powys – 5 μg/m³
Isles of Scilly – 4 μg/m³
Na h-Eileanan Siar – 4 μg/m³
Shetland Islands – 4 μg/m³